Trending > Market Intelligence
This is where you can see a visual overview of what content Leads 2 Business have published.
Market Intelligence > Projects
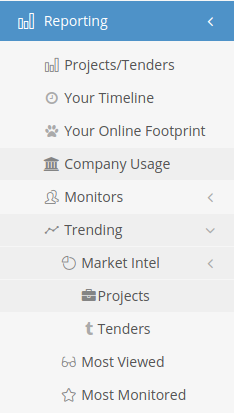
Click on ‘Reporting on the left side of the page and select ‘Trending’ and then ‘Projects’:
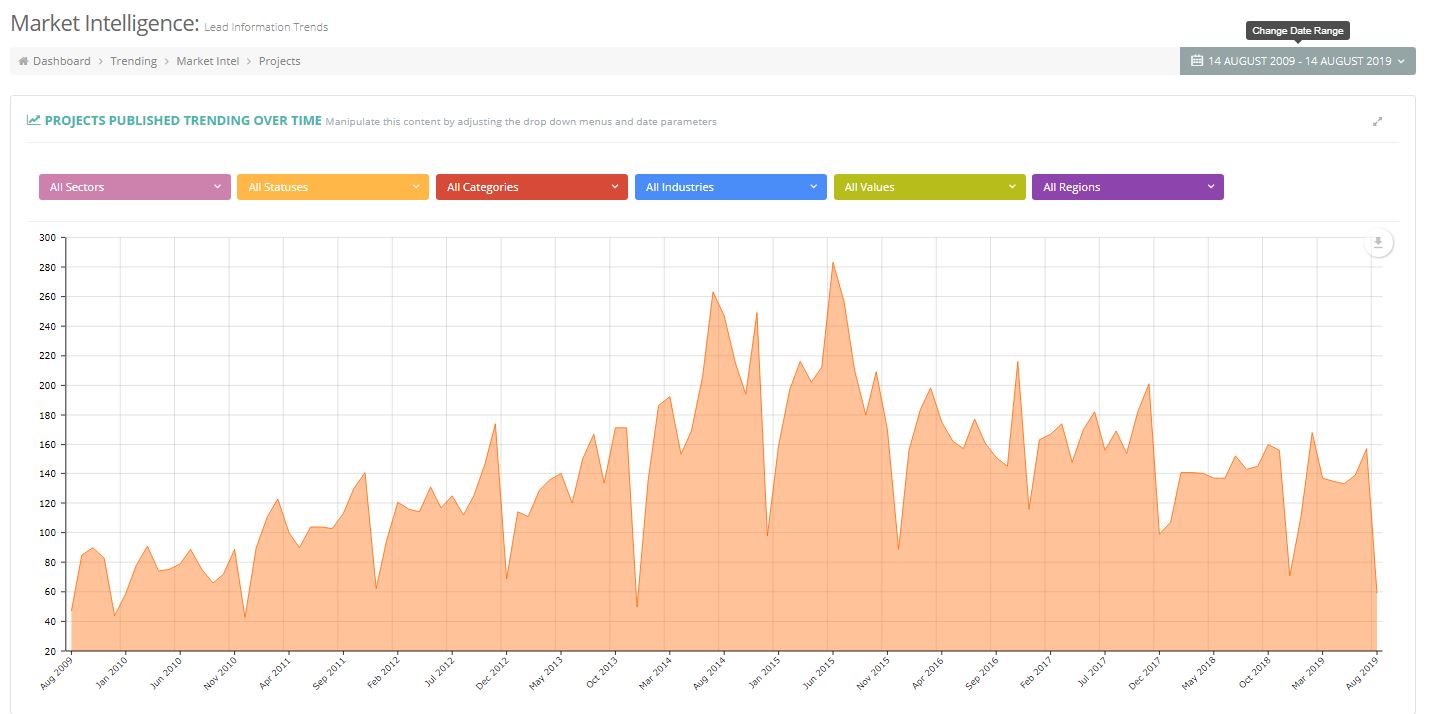
You can select your preferred date range ![]() at the top of the page and click apply, this will apply your date range to all the graphs.
at the top of the page and click apply, this will apply your date range to all the graphs.
To download any of the graphs click on the icon 
on the right-hand side of the graph: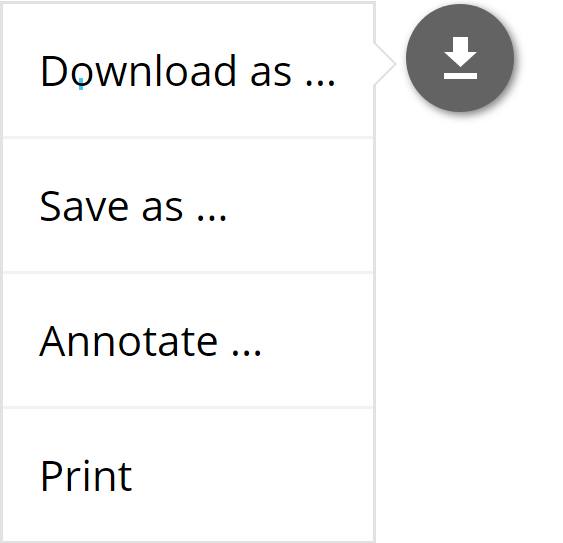
The![]() option at the bottom of each graph will display the results of the graph on the Search Page.
option at the bottom of each graph will display the results of the graph on the Search Page.
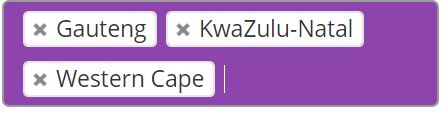
The menu’s also allow for multi selections which can be removed by clicking on each “x”: 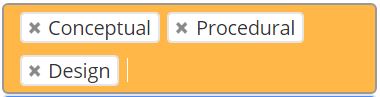
When generating a Report for Awarded Tenders the Awarded Date is prioritized over Published Date.
You will be able to pull graphs of:
- Projects published over Time
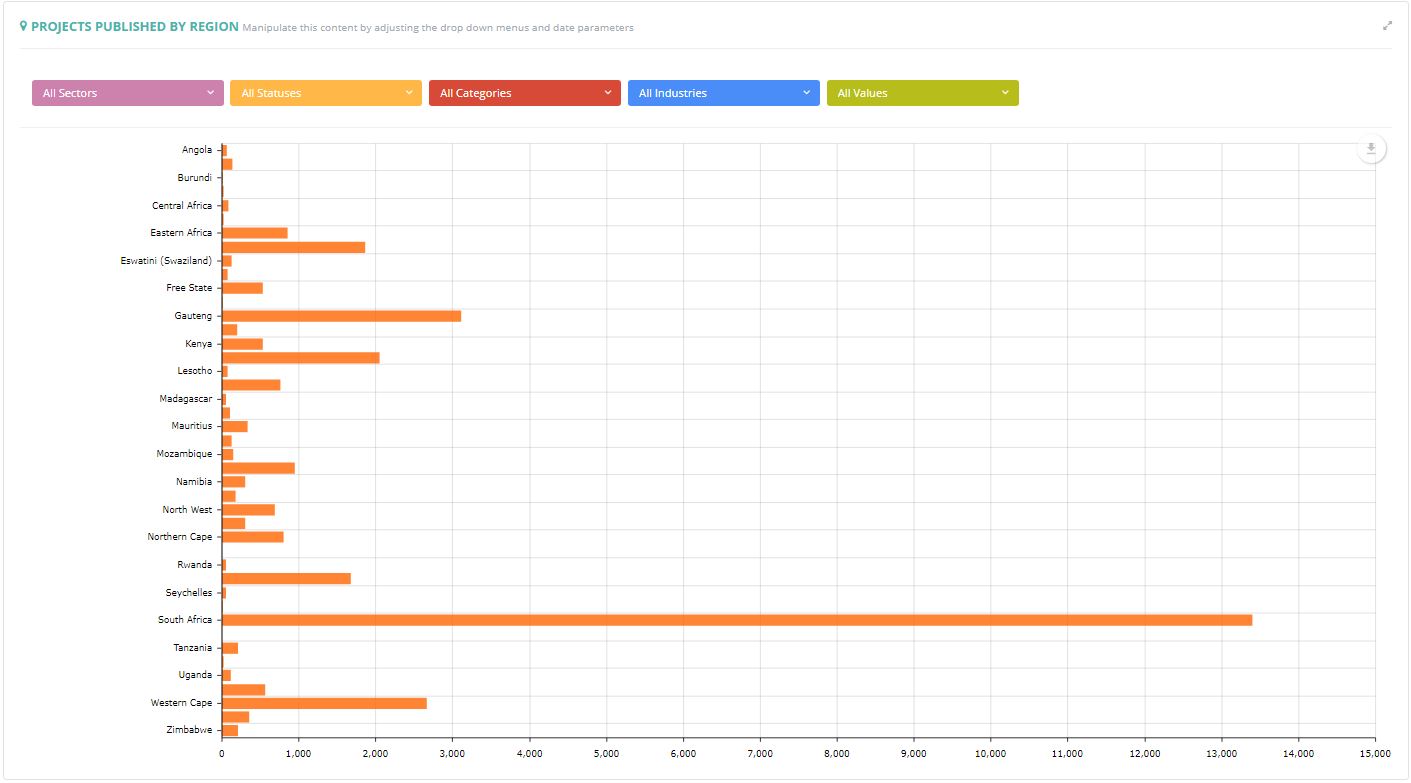
- Projects published by Region
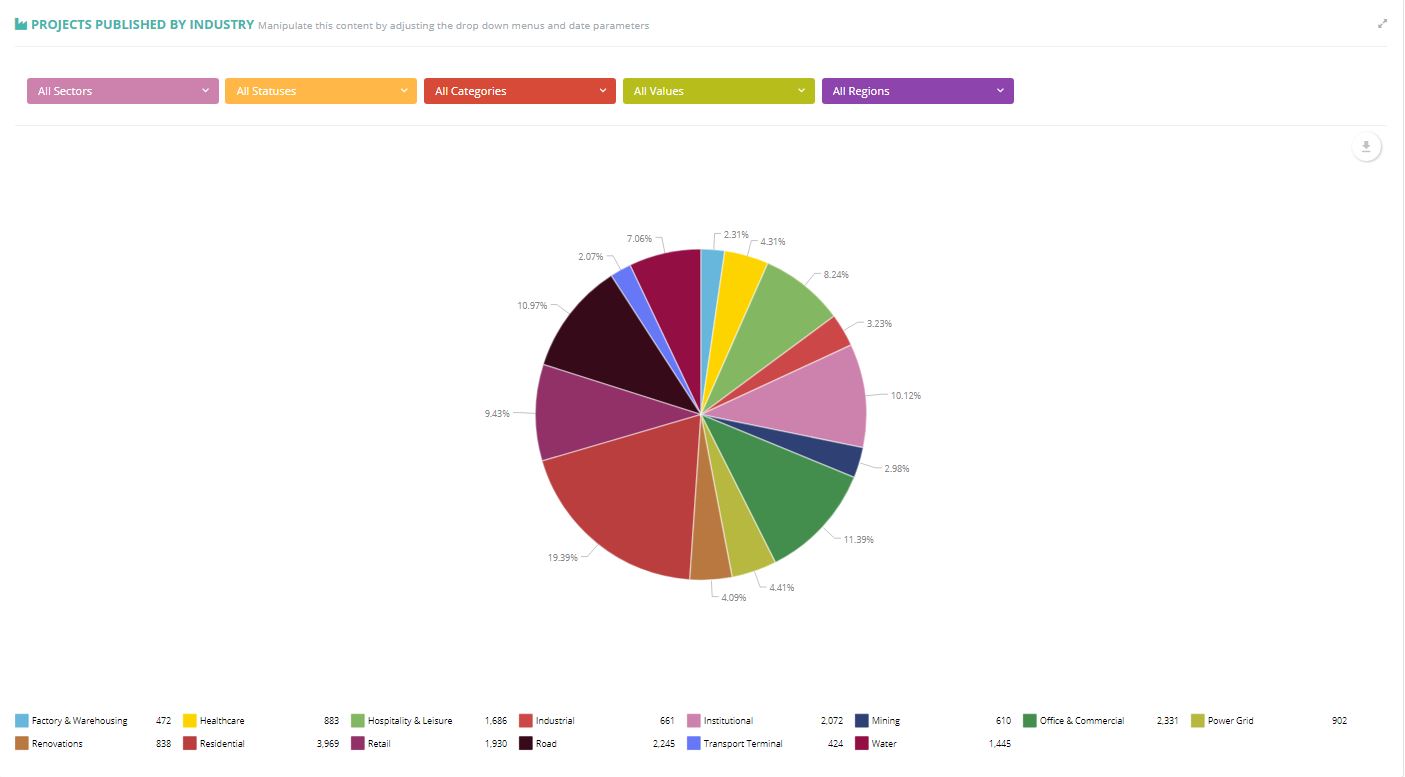
- Projects published by Industry
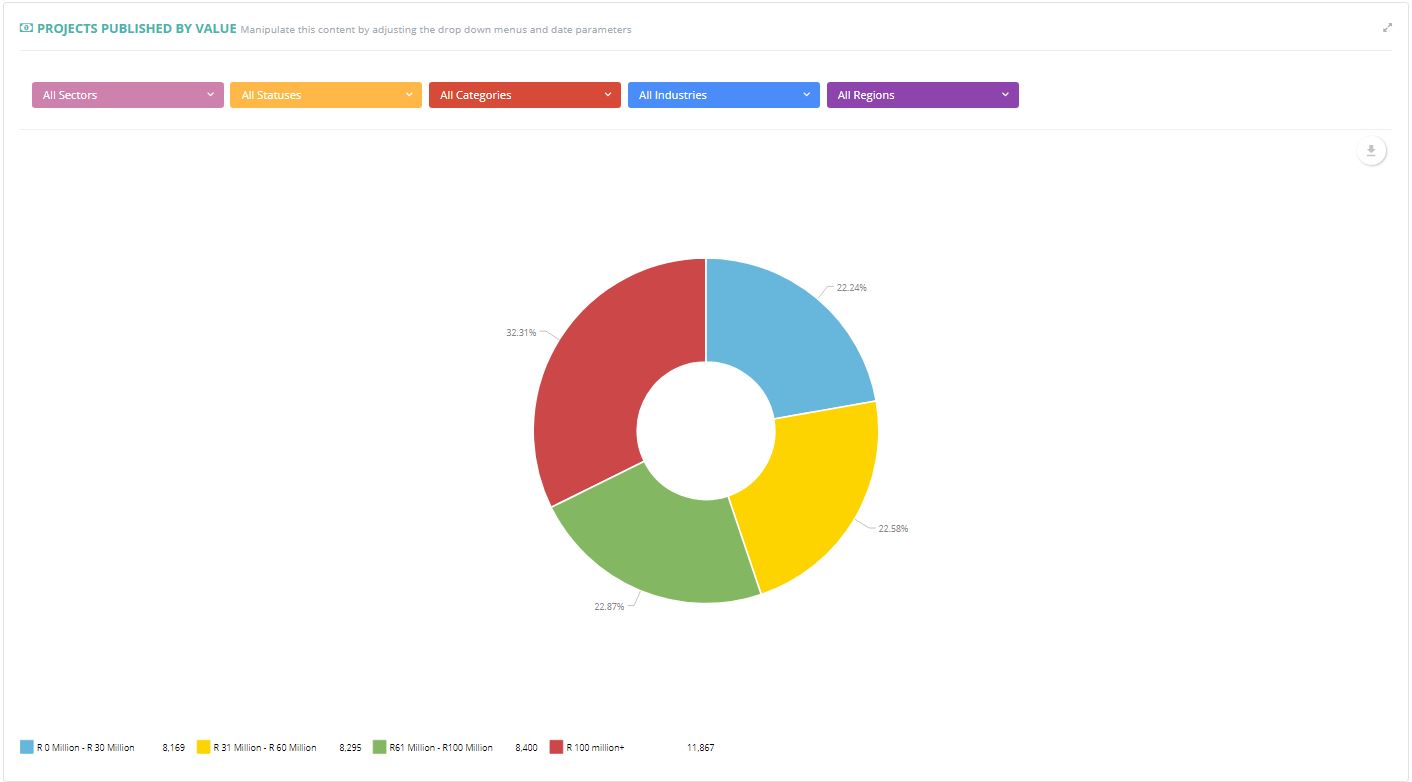
- Projects published by Value
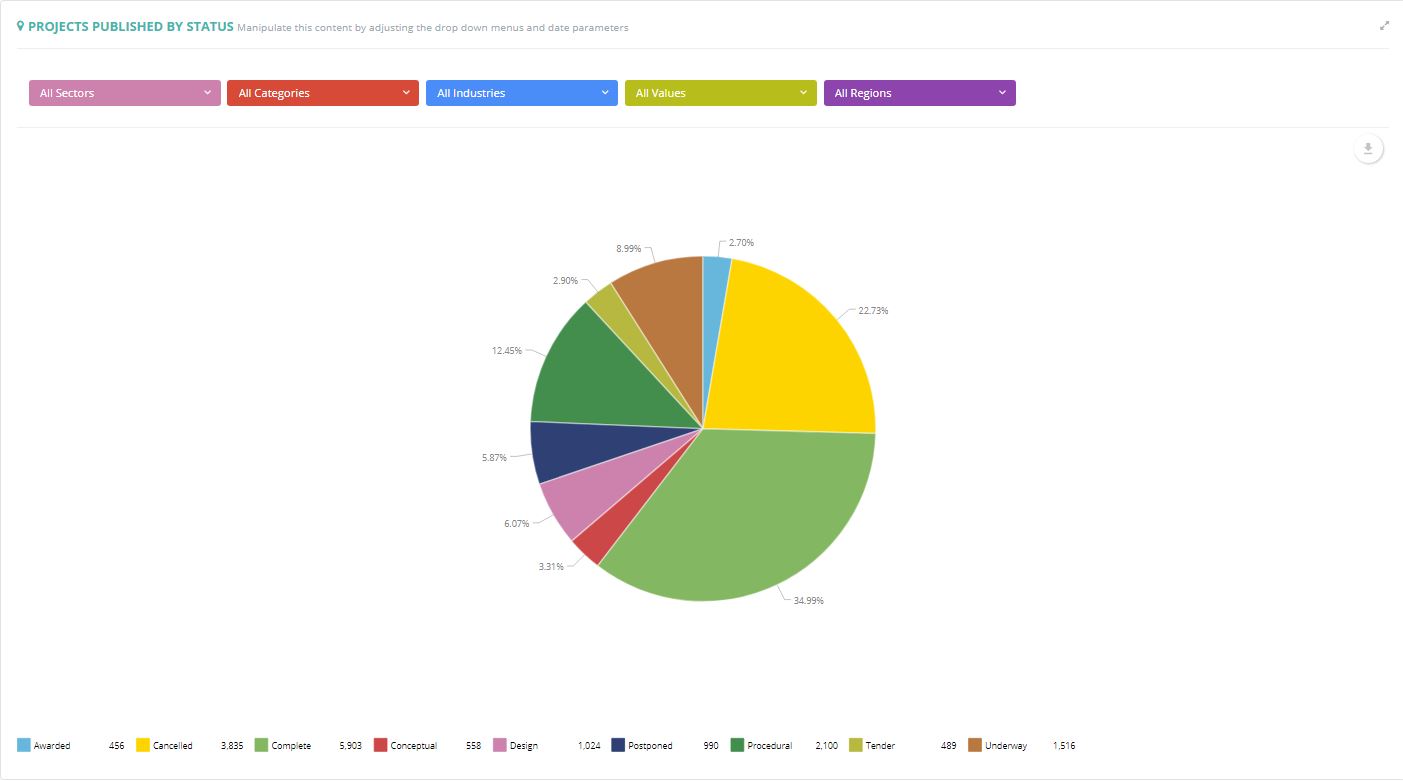
- Projects published by Status
Each graph will allow you to customize the data by selecting options, e.g. Sector, Status, Values, Category, Industry and Region:
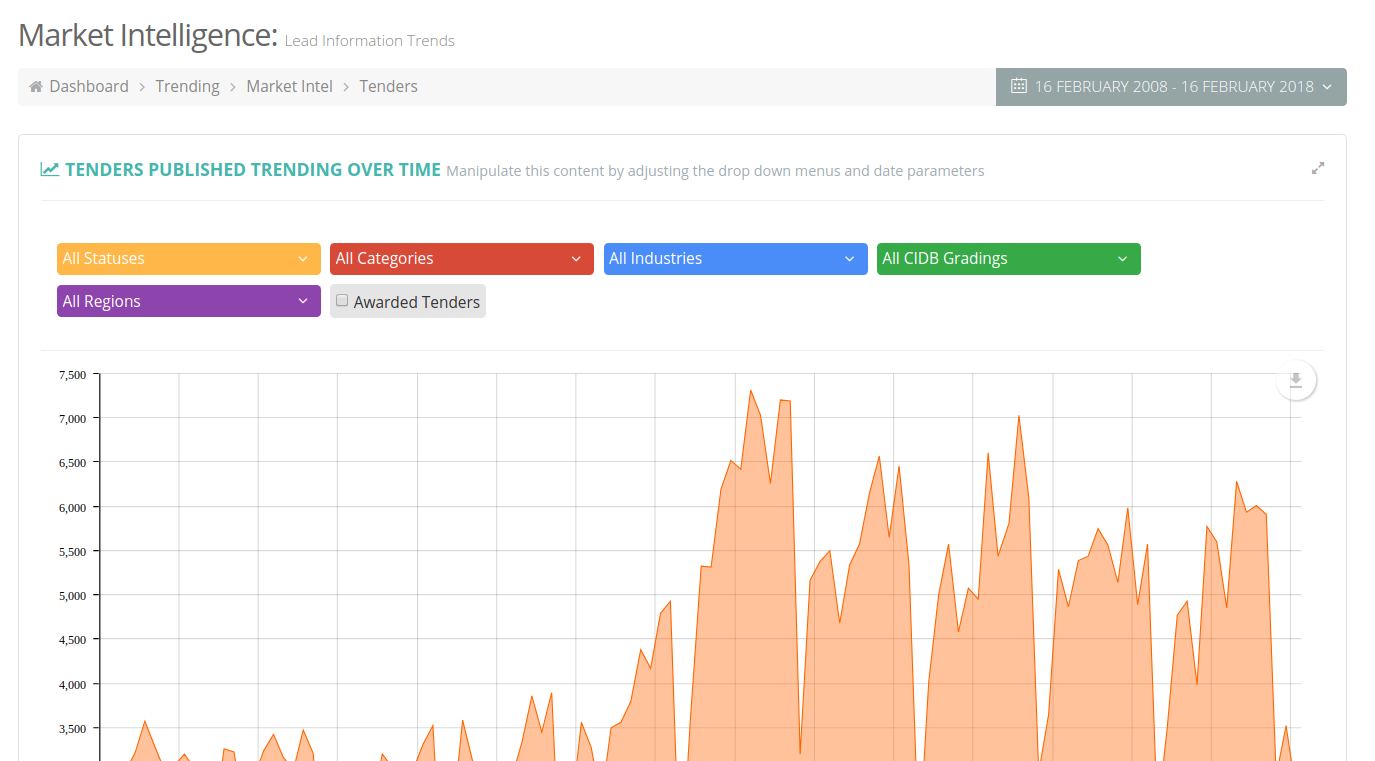
Trending > Market Intelligence: Tenders
Click on ‘Reporting on the left side of the page and select ‘Trending’ and then ‘Tenders’:
You can select your preferred date range at the top of the page and click apply, this will apply your date range to all the graphs:
You will be able to pull graphs of:
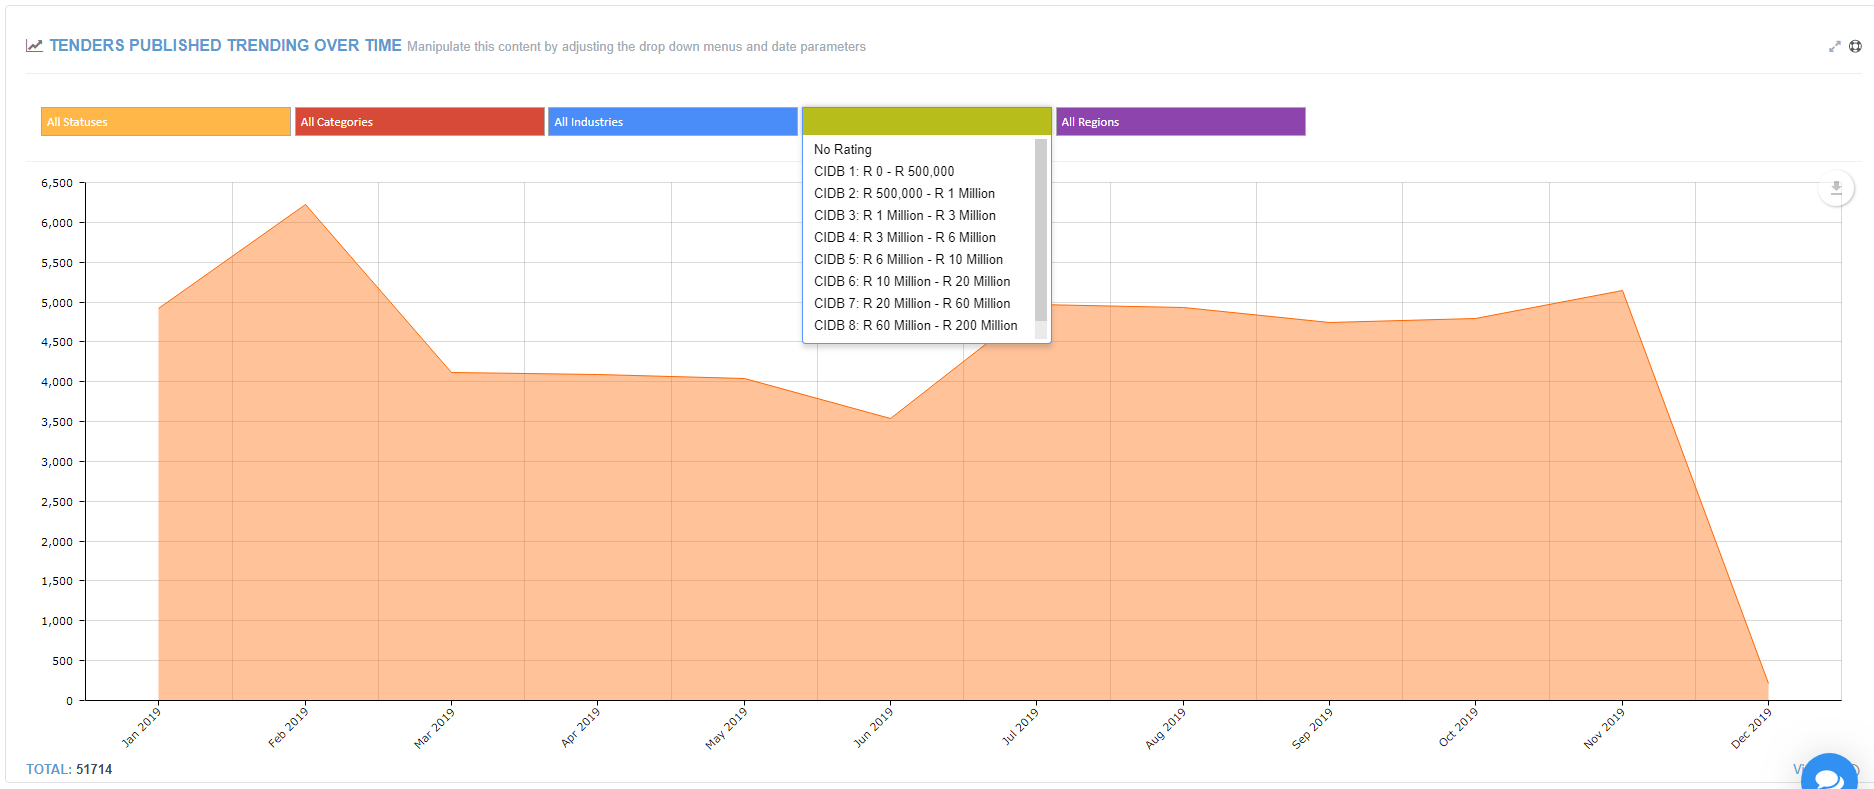
- Tenders published over Time
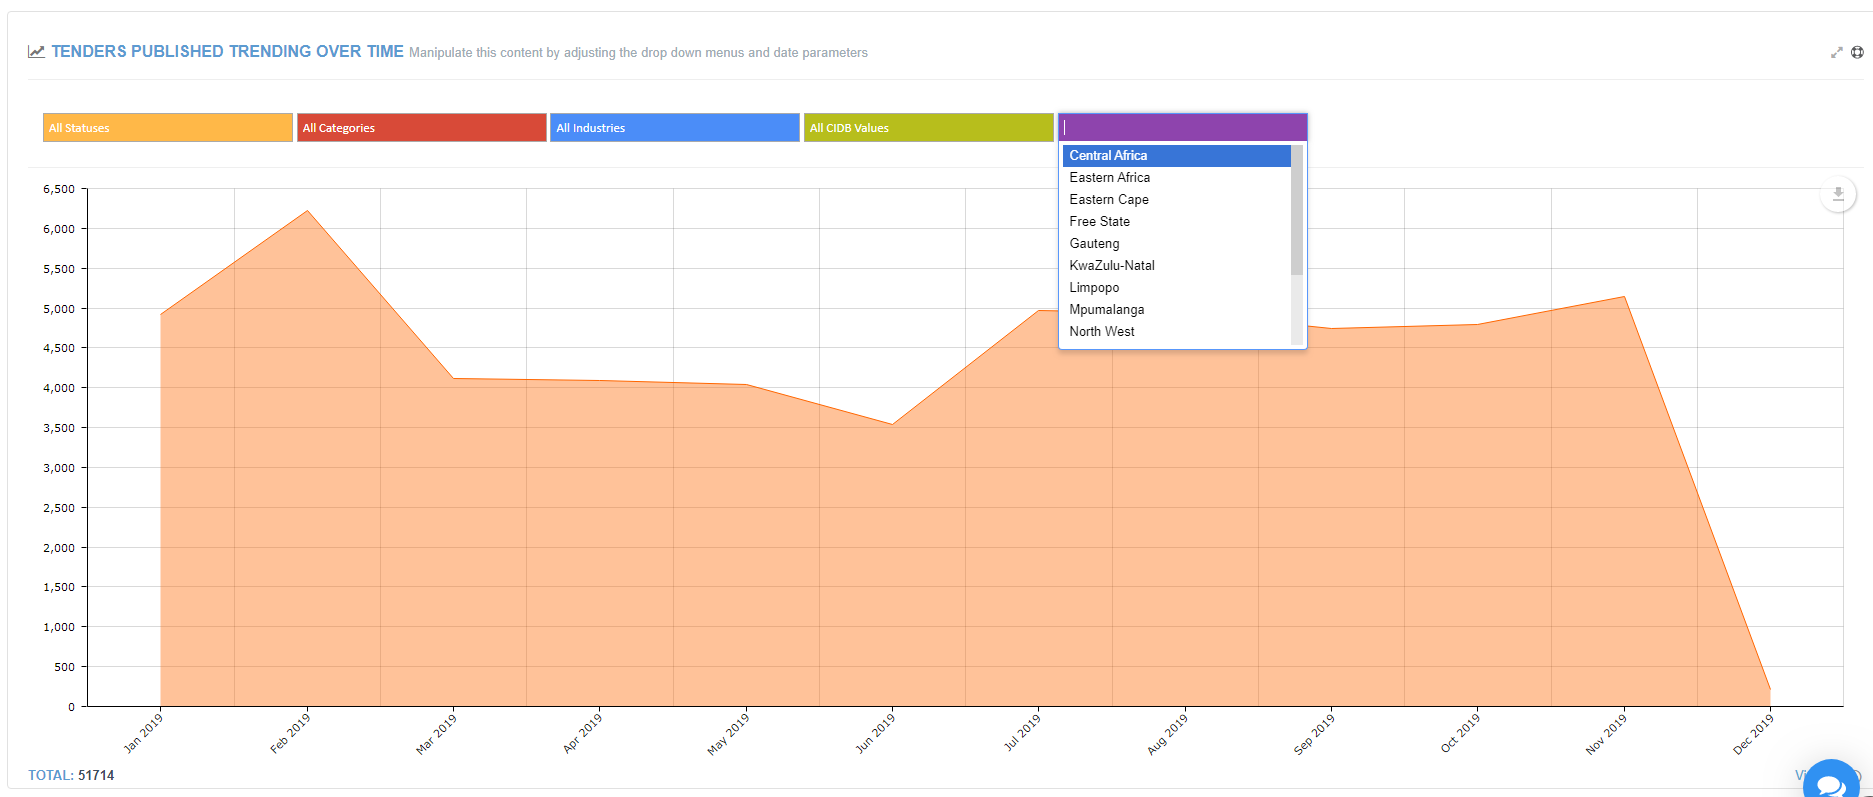
- Tenders published by Region
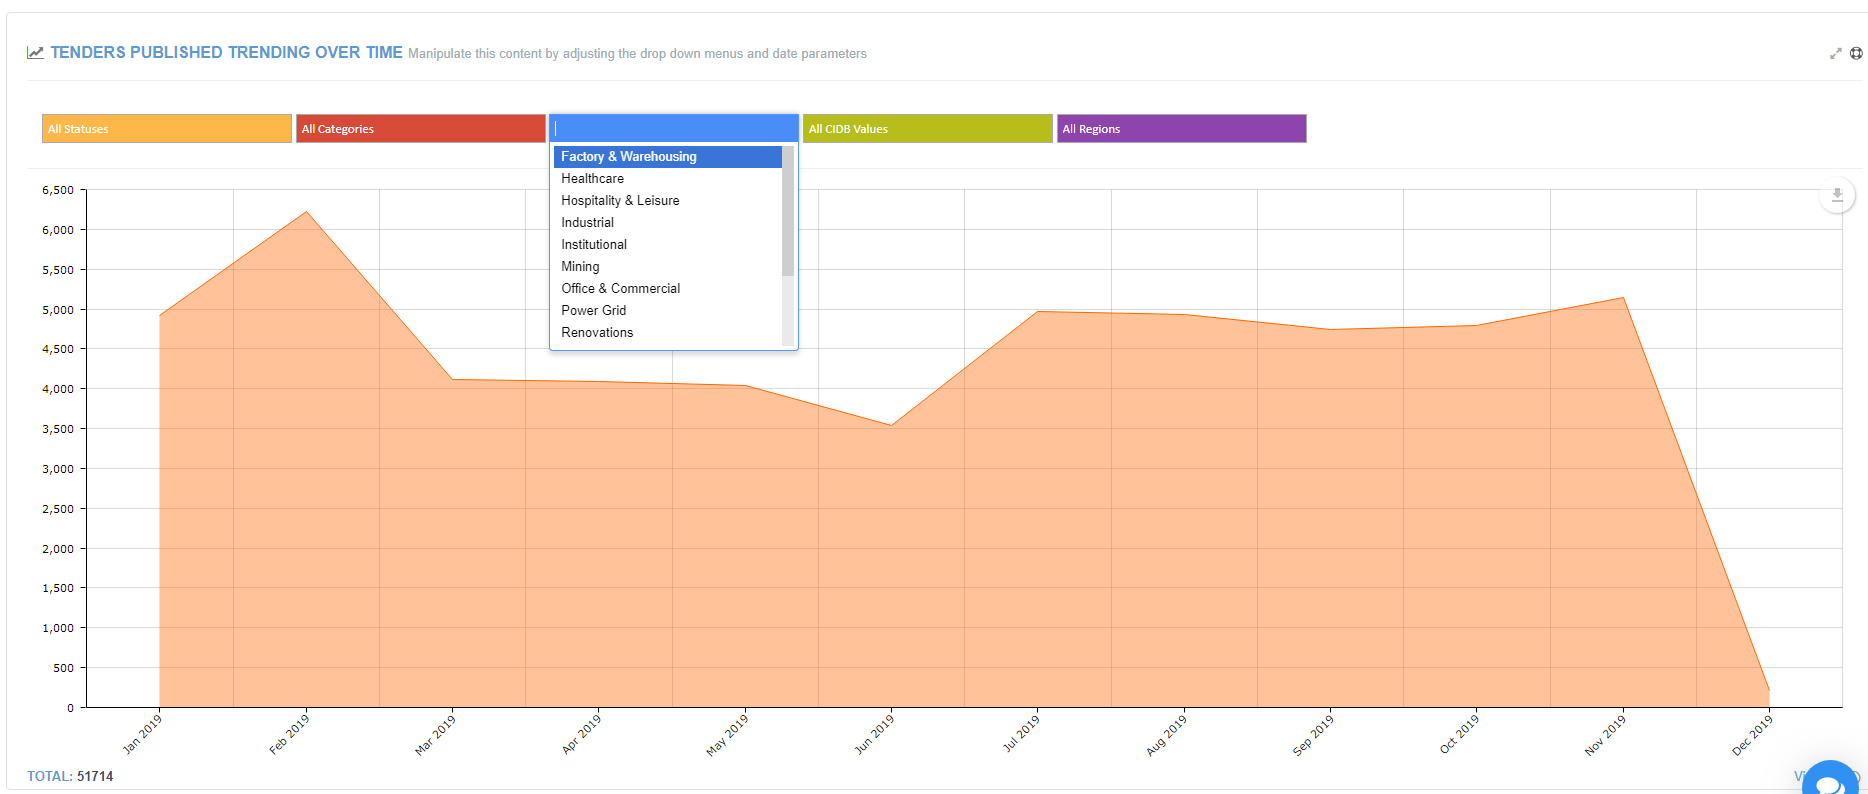
- Tenders published by Industry
- Tenders published by Value
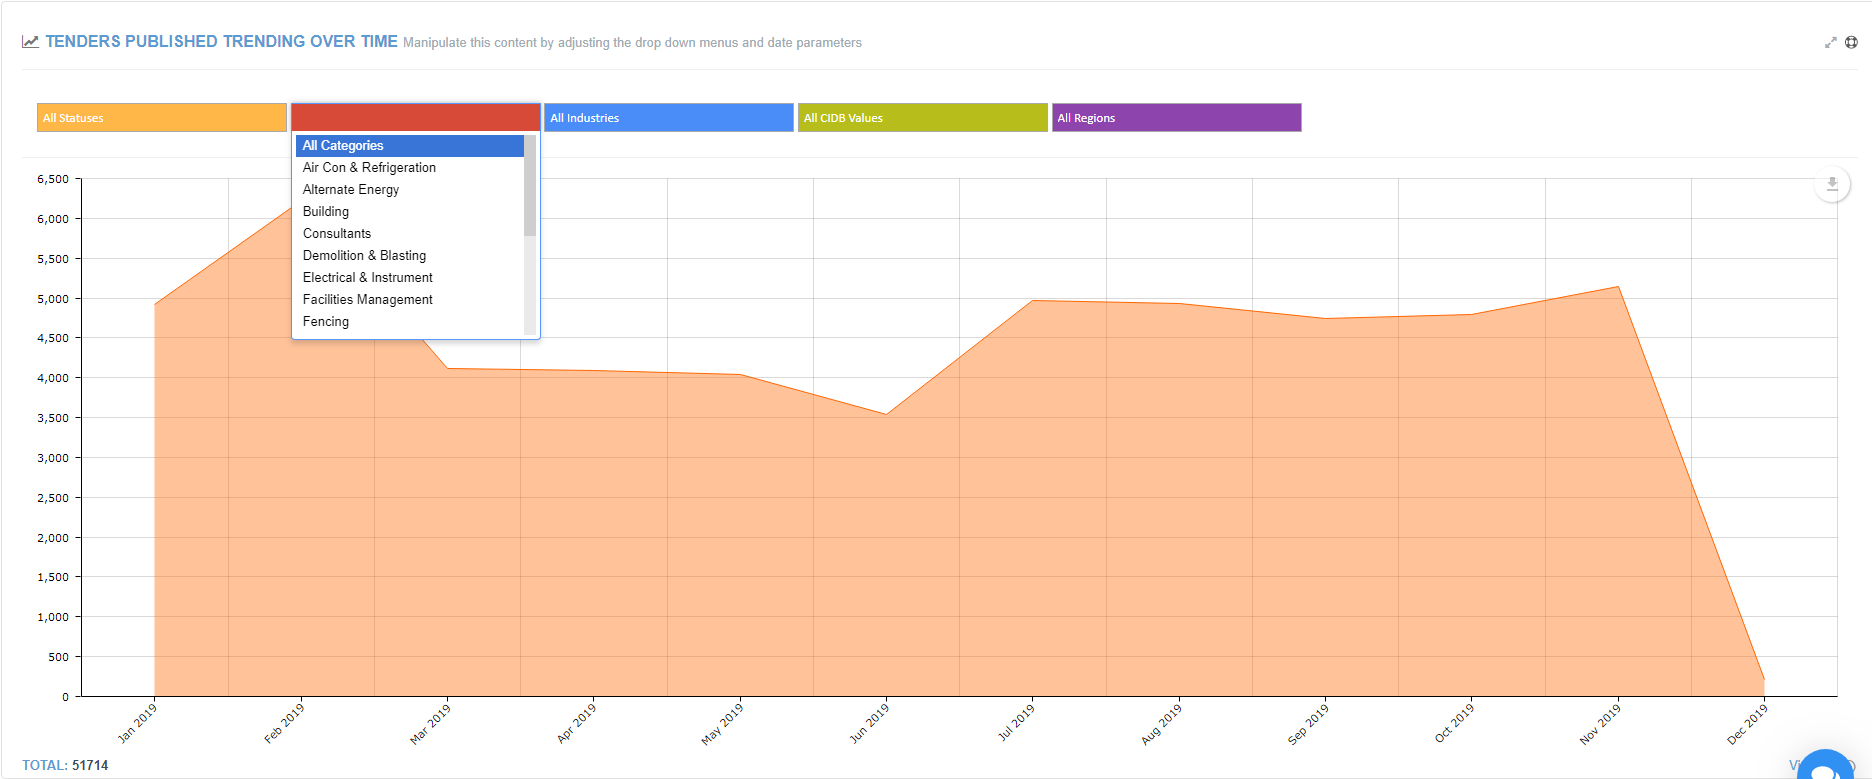
- Tenders published by Category
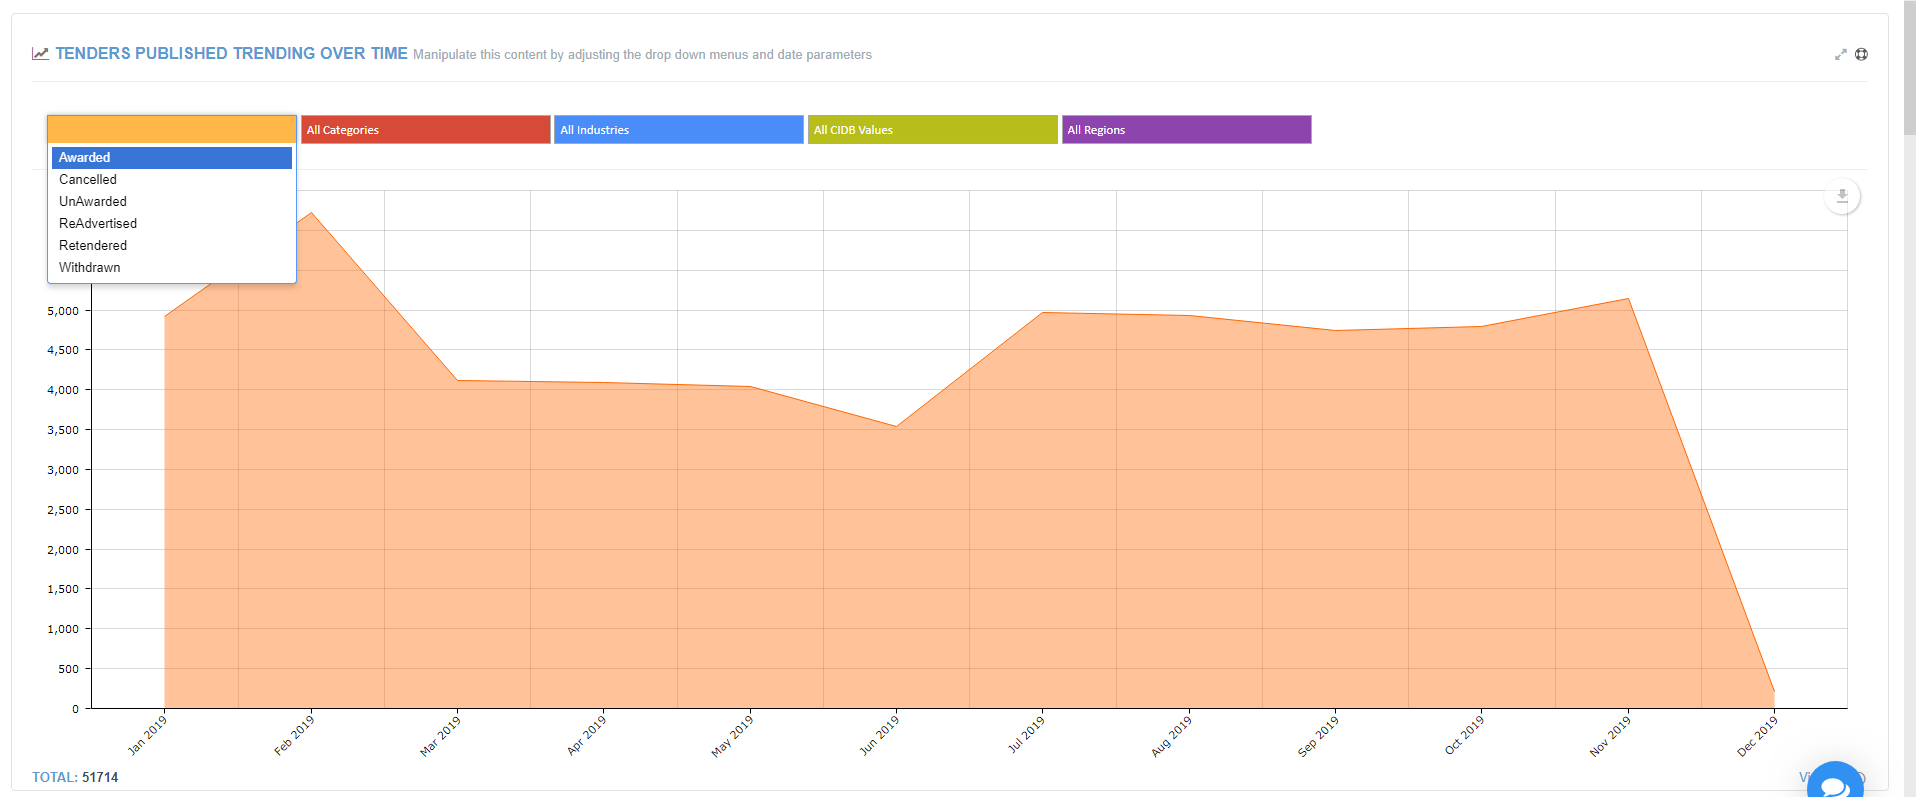
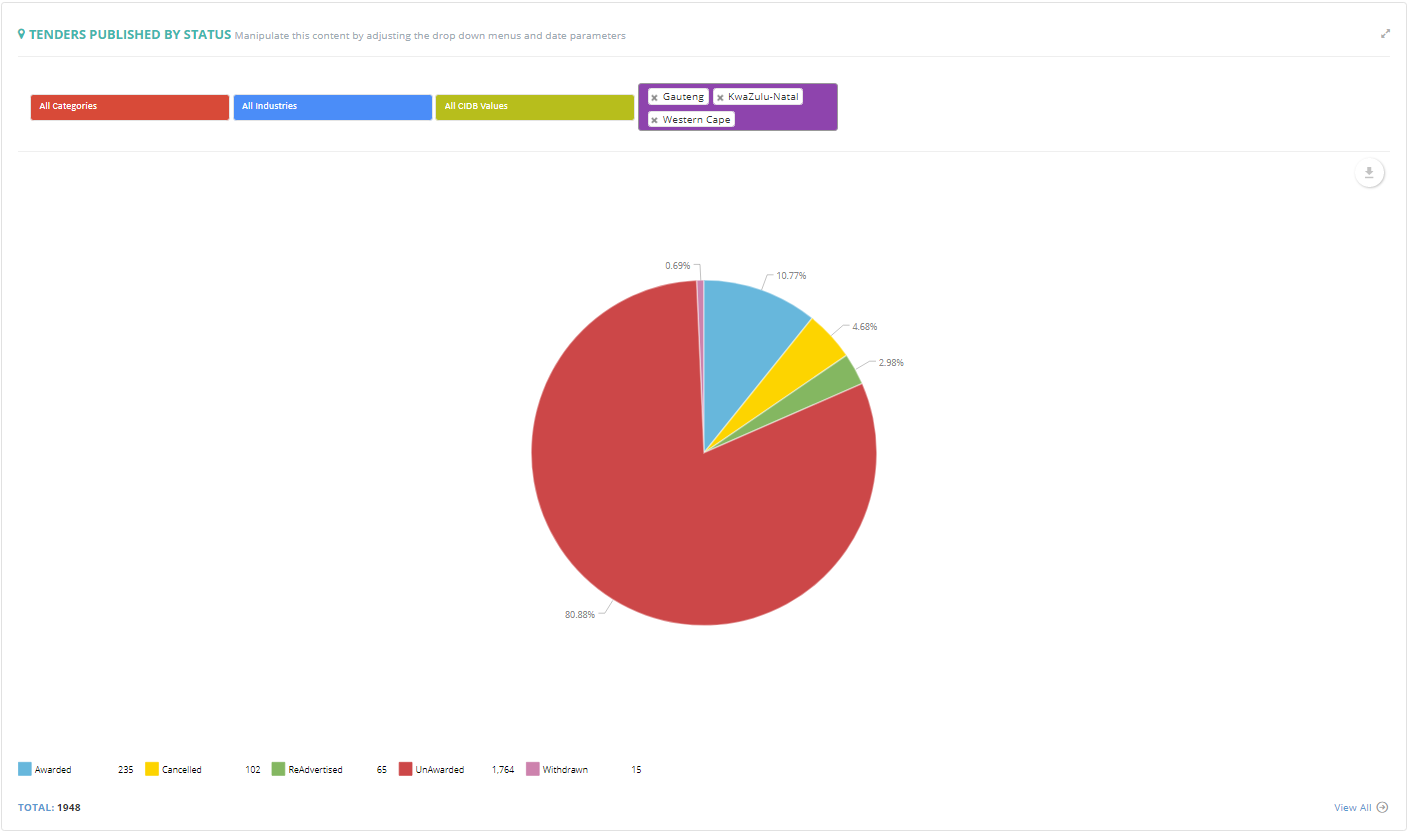
- Tenders published by Status
Each graph will allow you to customize the data by selecting options, e.g. Status, Categories, Industries, CIDB Gradings, Regions and Awarded Tenders.
When generating a Report for Awarded Tenders the Awarded Date is prioritized over Published Date.
The menu also allows for multi selections which can be removed by clicking on each “x”: